Google Jobs Intelligence for Job Boards
See exactly where you stand inside the Google Jobs widget — which button you hold on every job card, who's taking the slots you're losing, and why your revenue moved. The visibility layer your Search Console and revenue reports can't give you.
Share of voice
Carousel position · Top 5,000 keywords
| Source | #1 | #2 | #3 | #4 | #5+ |
|---|---|---|---|---|---|
| Indeed | 60 | 15 | 8 | 5 | 4 |
| 22 | 38 | 15 | 7 | 6 | |
| ZipRecruiter | 8 | 16 | 28 | 12 | 10 |
| Your board | 1 | 3 | 5 | 9 | 25 |
Illustrative snapshot · sample data
Your current KPIs tell you something changed — not what, or why
Search Console, BigQuery exports, and your internal clicks and revenue reports are good at one thing: flagging that Google Jobs performance moved. They’re poor at explaining it. When revenue dips, you run the same debugging loop every time — how many indexing-API requests went out, how many jobs published in the last three days, how the click totals look. That loop only catches extreme, obvious breakage.
It never catches the things that quietly move revenue:
- A competitor takes your slots for software engineer jobs while your inventory is completely unchanged — and nothing in your dashboards explains the drop.
- Revenue rises for no reason you shipped — because a rival disappeared from the widget and you absorbed their slots.
- You still rank for the same queries, but on fewer job cards, or you’ve slipped from the first button to the third.
None of this surfaces until it's already in the revenue line. By then the cheap, fast fix window has closed.
How it works
Built specifically for Google Jobs and refined across 300+ job board properties. This isn't generic rank tracking with a job-board label on top — it models the Google Jobs job card the way Google actually renders it: the buttons, their order, and who owns each one.
Normalized query groups
For each market, we define the normalized job-title queries that matter to you — chosen by revenue or by current ranking — and group them into clusters (every *software engineer* variant in one group, and so on).
Carousel position tracking
On your chosen cadence — weekly, bi-weekly, or monthly — every query is run against Google Jobs and we record which button your domain holds on each job card: position 1, 2, 3, or absent, across the first 10–20 results.
Share of voice and competitors
From that we compute your visibility per cluster, your average position over time, and the exact competitors winning the slots you don't — per query and per cluster.
Paired with your own data
Cross-referenced with your live jobs per cluster and your Google Jobs clicks, so every position change is read against inventory. That's what separates "we lost ranking" from "our job mix changed" — the distinction your current reports can't make.
What you see
One product, three levels — from the whole market down to a single keyword.
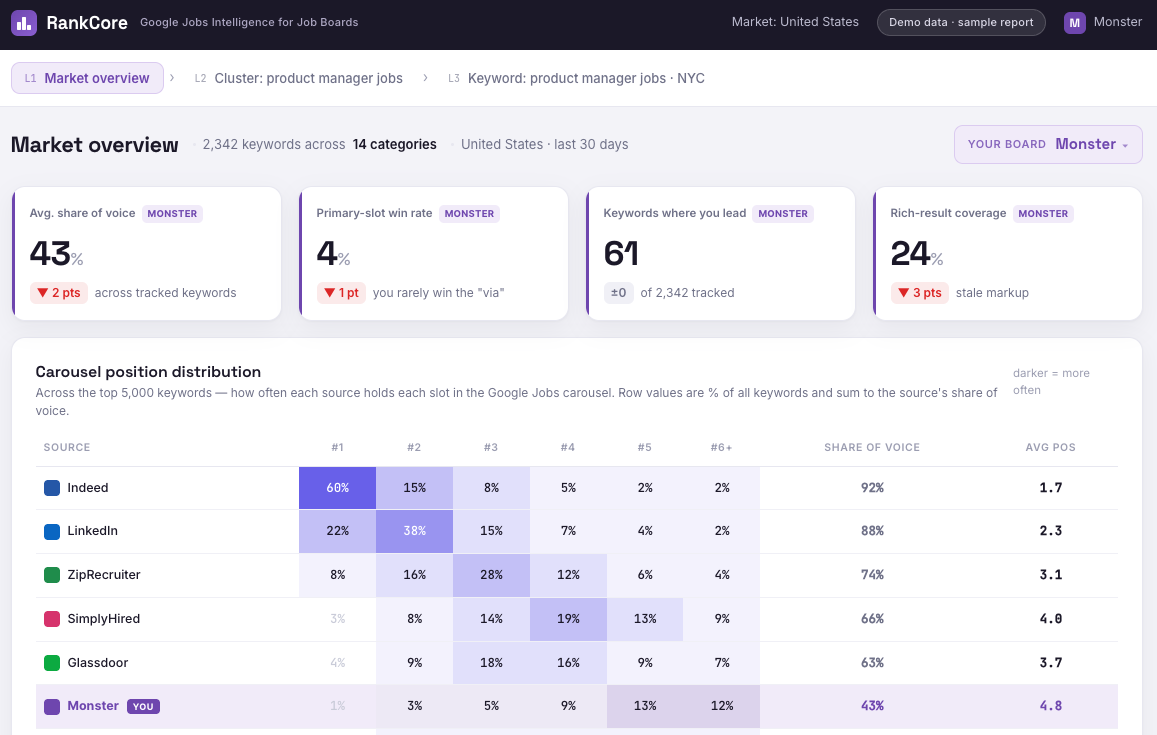
Market overview
Share of voice and carousel-position distribution across your entire query set — who holds position 1, 2, 3 and beyond across thousands of keywords, and where you sit against every competitor.
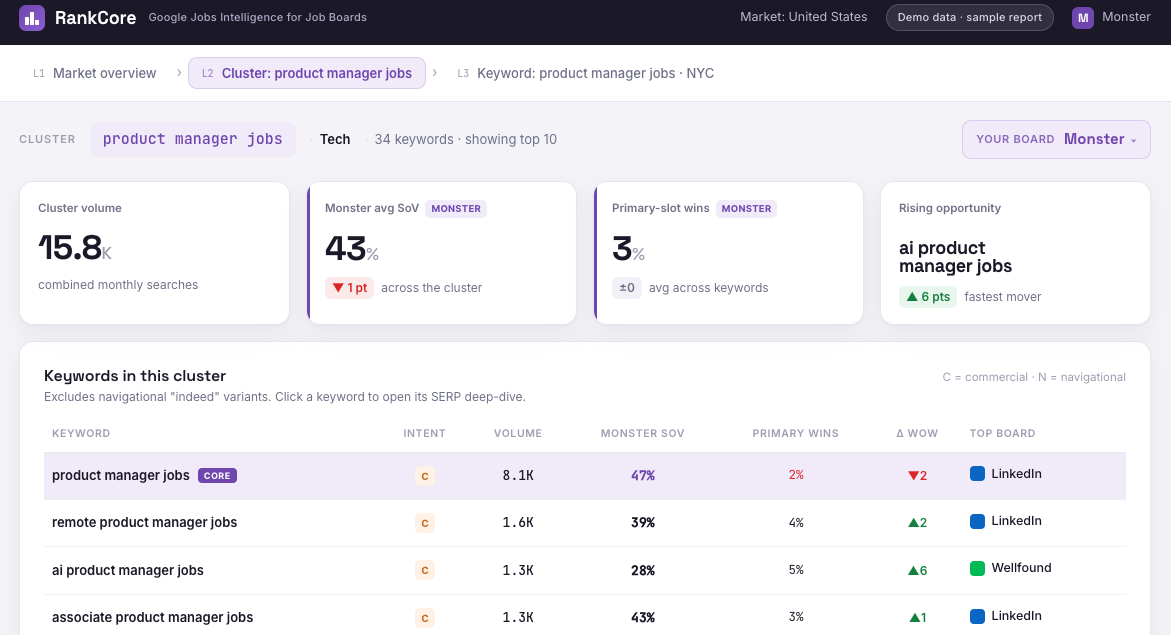
Cluster view
Drill into a query group — say *product manager jobs* — to see every keyword inside it, your share of voice, your primary-slot win rate, and the top board on each.
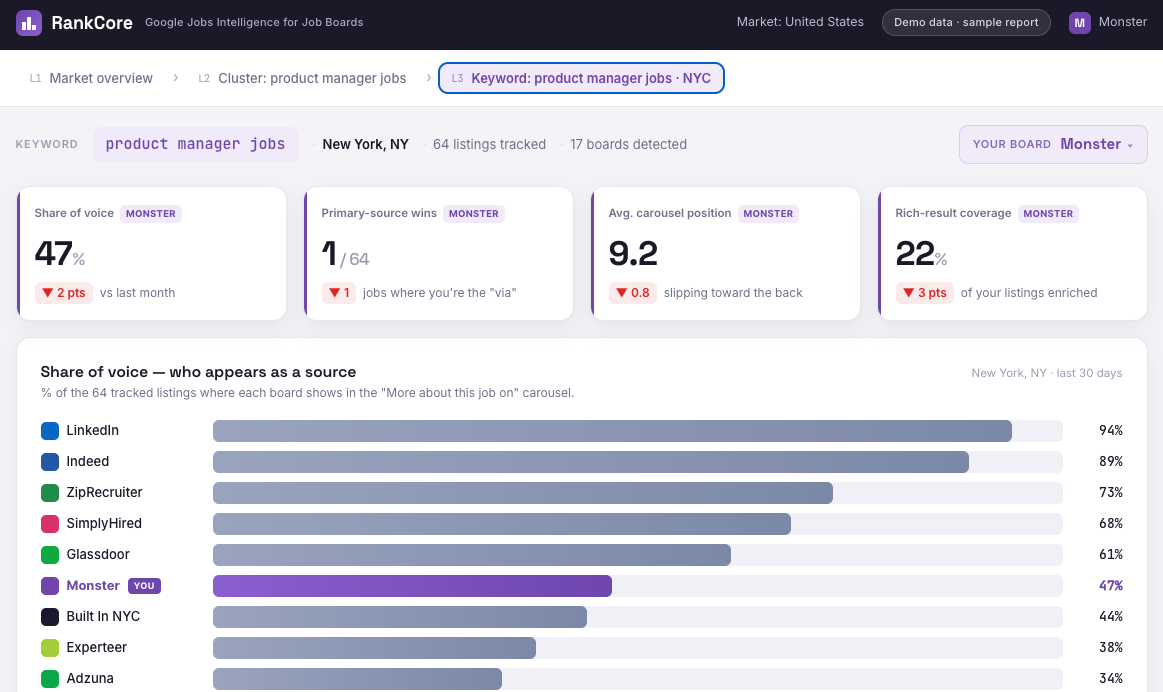
Keyword deep-dive
A single query and location: every job card, who wins the primary "via" slot, structured-data coverage by competitor, and an eight-week trend.
The signals it surfaces
Every cycle, the data is read for the patterns that actually move job-board revenue:
- Position drop with stable inventory — you’ve lost organic ground on a cluster. Plenty of causes — new entrants, a competitor’s content push, a feature change — but now you know exactly where to look.
- Ranking with fewer jobs — lost position, or an editorial/content gap worth filling on that cluster.
- Clicks falling while position holds flat — a job-mix change, or a brand-trust problem in that cluster — your brand isn’t winning the click even when you have the slot.
- Visibility drop — you appear on fewer cards for a set of keywords. Isolated quickly to either an inventory change or a ranking issue.
- New vendor onboarded — measure its real impact on your slots and positions instead of guessing whether the new supply helped or diluted you.
Without this view you can't tell whether what you shipped actually worked — or whether the number moved for reasons you were never measuring.
Beyond monitoring
- Smarter indexing-API spend. When you hit indexing-API limits, prioritize the jobs in clusters where you already hold the strongest Google Jobs position — spend the quota where it converts.
- Supply and demand gaps. Surface queries with real search demand but few jobs present — whitespace you can target with inventory before a competitor does.
Why generic SEO tools fall short
Ahrefs, Semrush, and Search Console track organic blue-link positions and aggregate symptoms. None of them model the Google Jobs widget — the job card, the button order, the primary “via” source. That carousel is where job-board revenue is actually won and lost, and it’s invisible to every general SEO platform. This product exists for that one layer, built by someone who’s worked inside these businesses across 300+ properties.
Pricing
Month-to-month, cancel any time. Tracking starts at signup — we capture Google Jobs data from your start date forward, never retroactively. The earlier you start, the deeper your trend history.
Monitor
Track the market
- ✓ Up to 5,000 tracked queries from our job-board market query set, mapped to your markets and verticals
- ✓ Full dashboard — market, cluster, and keyword views
- ✓ Your chosen cadence — weekly, bi-weekly, or monthly
- ✓ Historic data from signup
- ✓ Per-client login
Monitor Plus
Track what matters to you
- ✓ Everything in Monitor
- ✓ 2,000 custom queries you choose — your priority titles, locations, and clusters, tracked specifically for you
- ✓ Tracked specifically for you, alongside the market set
Managed
Monitoring + monthly insight
- ✓ Everything in Monitor Plus
- ✓ Monthly insights report, written for your site:
- ✓ Prioritized schema improvements
- ✓ Competitor-movement analysis
- ✓ Backlink / link-gap suggestions
All tiers are read-only — no write access to your stack is required. Recommended commitment is 6 months: trend history and competitive shifts compound over the first couple of quarters.
Frequently Asked Questions
Can you give me data from before I sign up?
How are the 5,000 queries chosen?
How is this different from Search Console, Ahrefs, or Semrush?
What access do you need from us?
Is my data private?
How soon is the first report ready?
What cadence do you track at?
Request Access
Tell me about your site and which markets matter, and I'll set up access and come back with anything that needs scoping within two business days.